In both bills, the bulk of the costs in health care reform lay in expansions to Medicaid and CHIP outlays and in subsidies paid through the Exchange programs.
Additional costs appear in the form of tax credits to small businesses and other relatively smaller costs.
In theH.R. 3962, projected costs over the 2010-2019 time period include $425 billion in Medicaid and CHIP outlays, $605 billion in exchange subsidies, and $25 billion in small employer tax credits. Thus, the total increase in federal costs in the house bill is $1055. Compared to H.R. 3200, the new bill would reduce costs by $209 billion.
Costs of expansions in coverage in the Senate Finance mark total to about $829 billion over the ten year period of 2010-2019. This total includes $345 billion in additional federal outlays for Medicaid and CHIP, $461 billion in subsidies that would be provided to purchase insurance through the new insurance exchanges as well as related spending, and $23 billion in tax credits for small employers who offer health insurance to their employees.
$829 billion [total cost of provisions in the Senate Finance mark] = $345 billion [additional Medicaid/CHIP outlays] + $461 billion [exchange subsidies and related spending] + $23 billion [small employer tax credits]
The CBO cost estimates cited here also refer to a $518 billion 'net cost of expansions in coverage.' This refers to the combined budgetary effects of the combined costs of insurance coverage provisions balanced against releated revenues and savings from other sources.
$518 billion [net cost of expansions in insurance coverage in the Senate Finance mark] =$829 billion [total costs of provisions] - $201 billion [revenues raised from excise taxes on high premium insurance plans] - $110 billion [net savings from other sources]
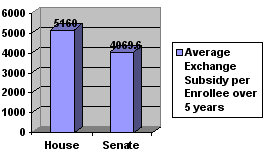
The Senate Finance mark would spend less per enrollee on Exchange subsidies.
Averaged across the years 2015 to 2019, the House bill will spend an additional $1120 per enrollee as compared to the Senate Finance mark.The projected difference for 2019 will be $1300 per enrollee.Compared against H.R. 3200, H.R. 3962 will spend an average of $980 more per enrollee than the previous house health care bill.
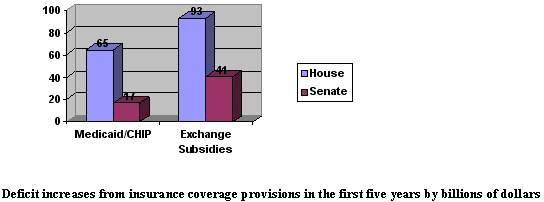
In general, the House bill is expected to spend more than the Senate bill would. Medicaid, CHIP, and Exchange subsidy outlays are much larger in the House bill over a ten year period.This is especially true during the first five years where the House bill would create a projected deficit increase of 158 billion dollars for these items versus 58 billion in the Senate version.Over the first ten years of enacting health care reform, the projected difference in spending between the two bills would be about $224 billion.
This difference in spending is especially noticeable in the first 5 years:
The Senate Finance bill would spend less per enrollee on Exchange subsidies.Averaged across the years 2015 to 2019, the House bill will spend an additional $140 per enrollee as compared to the Senate bill.The projected difference for 2019 will be $500 per enrollee.
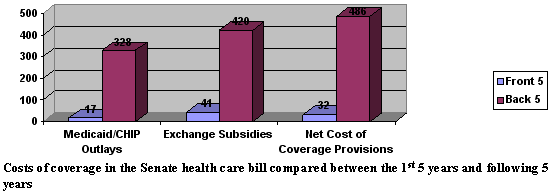
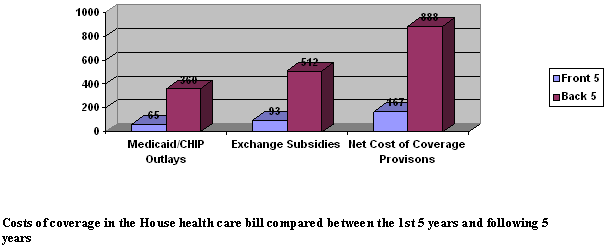
The predominant costs and effects in both the House and Senate bills do not start until about 2015. Looking at the analysis over the course of ten years (from 2010-2019), one sees much more noticeable costs and effects in what we are calling the “back 5” of the analysis. The charts below, for example, illustrates the projected costs of coverage in the Senate and House bills by billions of dollars in two different spending categories as well as the net financial effects of the bill, split between the front and back 5.
H.R. 3962 adds over a trillion dollars in new entitlement spending over ten years but this amount is not evenly distributed over that period. Almost all of that spending is over 5 years. Looking at the outlays in 2019, there is $85 billion in additional outlays for Medicaid and $120 billion in additional spending for exchange subsidies. That is a rate of over $2 trillion over an operating ten year period, not accounting for what CBO states would be an 8% rate of growth in the spending amount.
****All figures above are based on CBO cost estimates which can be found here:***


.bmp)
.bmp)